Step 3: Quality Report
After training finishes, you typically have several checkpoints. It is hard to tell which point is best from loss numbers alone — you ultimately need to listen.
The quality report synthesizes the same sentences from multiple checkpoints and bundles them into a single HTML file. Compare them side by side in your browser and pick the best one.
Running
After training, launch the CLI and select Quality Report from the main menu.
uv run poe cliOnly datasets that have finished training (those with exports/<model_name>/*.safetensors) are listed. Datasets that have only been preprocessed will not appear.
After selecting a speaker, the CLI prints the checkpoint list and asks for an evaluation text preset.
? Select Speaker tsukuyomi

  Using 5 checkpoints
    · hayakoe_tsukuyomi_e15_s500
    · hayakoe_tsukuyomi_e30_s1000
    · hayakoe_tsukuyomi_e45_s1500
    · hayakoe_tsukuyomi_e59_s2000
    · hayakoe_tsukuyomi_e74_s2500

? Select Text
  > Sample - Short (3)
    Sample - Medium (2)
    Sample - Long (1)
    Sample - All (6)
    Enter manually
    Back
Evaluation Text Selection
Choose one of the presets for the comparison sentences.
- Sample - Short (3)
- "おはようございます。今日もよろしくお願いします。"
Good morning. Looking forward to working with you today. - "えっ、本当ですか?それはすごいですね!"
Really? That is amazing! - "静かな夜に、星が綺麗に見えます。"
On a quiet night, the stars look beautiful.
- "おはようございます。今日もよろしくお願いします。"
- Sample - Medium (2)
- "先週の土曜日、家族で動物園に行きました。子供たちはパンダを見てとても喜んでいました。天気も良くて、最高の一日になりました。"
Last Saturday, we went to the zoo as a family. The kids were thrilled to see the pandas. The weather was great too, making it a perfect day. - "音声合成の技術は年々進化しています。最近では人間の声と区別がつかないほど自然な音声を生成できるようになりました。今後の発展が楽しみです。"
Speech synthesis technology advances every year. Recently, it has become possible to generate voices so natural they are indistinguishable from humans. Looking forward to future developments.
- "先週の土曜日、家族で動物園に行きました。子供たちはパンダを見てとても喜んでいました。天気も良くて、最高の一日になりました。"
- Sample - Long (1)
- "春が来ると、日本中で桜が咲き始めます。人々は公園や川沿いに集まって、お花見を楽しみます。友人や家族と一緒にお弁当を広げ、美しい花びらが舞い散る様子を眺めるのは、日本の春の風物詩です。桜の季節は短く、わずか一週間ほどで散ってしまいますが、その儚さがまた人々の心を惹きつけるのかもしれません。"
When spring arrives, cherry blossoms begin to bloom across Japan. People gather in parks and along rivers to enjoy hanami. Spreading out lunch boxes with friends and family while watching beautiful petals flutter down is a quintessential scene of Japanese spring. Cherry blossom season is short, lasting only about a week before they fall, but perhaps it is that ephemerality that captivates people.
- "春が来ると、日本中で桜が咲き始めます。人々は公園や川沿いに集まって、お花見を楽しみます。友人や家族と一緒にお弁当を広げ、美しい花びらが舞い散る様子を眺めるのは、日本の春の風物詩です。桜の季節は短く、わずか一週間ほどで散ってしまいますが、その儚さがまた人々の心を惹きつけるのかもしれません。"
- Sample - All (6) — All of the above combined
- Enter manually — Type your own sentences (end with an empty line)
Output
A single HTML file is generated at <dataset>/reports/report_<YYYYMMDD_HHMMSS>.html. On WSL2, the option to open it in the default browser is provided.
The HTML contains two things.
- 6 training metric charts — Loss change graphs. Useful as reference for checkpoint selection, but the final decision should be by ear.
- Audio comparison table — Rows are evaluation sentences, columns are checkpoints. Click the
<audio>player in each cell to listen directly.
Easy to share
WAV files are embedded as base64 inside the HTML, so transferring a single file brings all audio with it.
You can upload it directly to Slack or Notion and it plays without external file dependencies.
Internal details — Checkpoint sampling and generation order
Checkpoint Sampling
When there are more than 8 checkpoints, they are automatically sampled evenly (first, last, plus 6 in between). Even with 10 or 20 saved, the page will not overflow horizontally.
Generation Order
- Collects scalar metrics from TensorBoard event files in
<dataset>/training/and<dataset>/training/eval/. - Loads checkpoints one by one with
hayakoe.tts_model.TTSModel, synthesizes all evaluation texts, then unloads. Only one is loaded into memory at a time to conserve VRAM. - Assembles the metric charts and audio table into a self-contained HTML.
Reading the Report
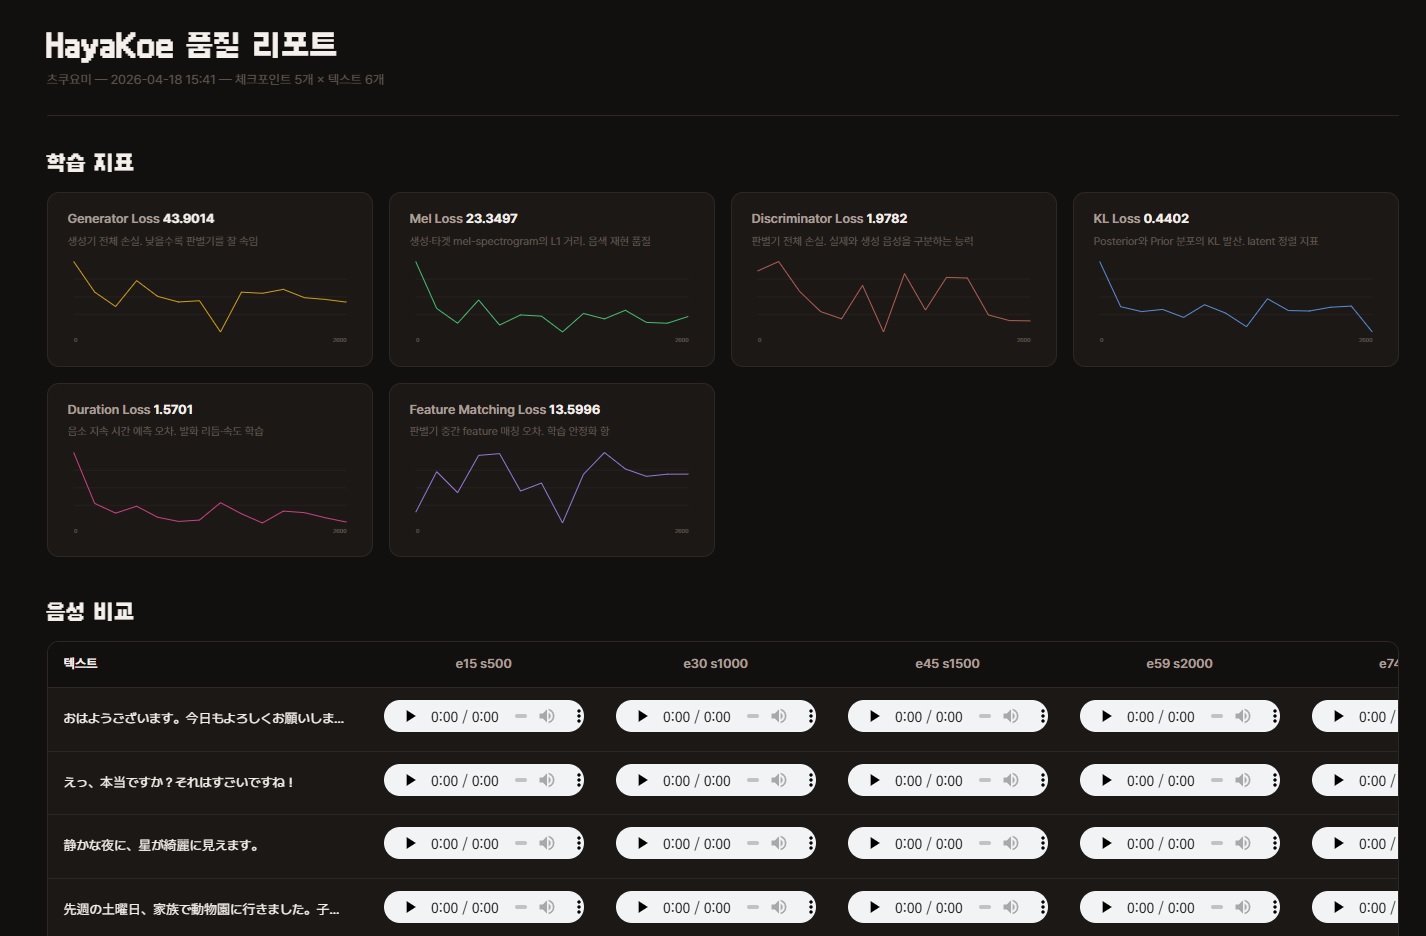
When you open the report, you first see 6 training metric charts, followed by the audio comparison table.
Focus on the audio comparison table. Do not decide based on loss numbers alone — once overfitting begins, numbers keep decreasing but the listening experience actually gets worse.
6 Training Metric Charts
The number in the upper right of each chart is the last step value. The curve shape matters, but check the endpoint first.
- Generator Loss — Total generator loss. Lower means better at fooling the discriminator
- Mel Loss — L1 distance between generated and target mel-spectrograms. Timbre reproduction quality
- Discriminator Loss — Total discriminator loss. Ability to distinguish real from generated audio
- KL Loss — KL divergence between posterior and prior distributions. Latent alignment metric
- Duration Loss — Phoneme duration prediction error. Utterance rhythm and speed learning
- Feature Matching Loss — Discriminator intermediate feature matching error. Training stabilization term
Which Checkpoint to Pick
Listen to all of them and pick the one that sounds best.
Note that the last checkpoint is not always the best. With limited data, later checkpoints can actually sound more awkward, so be sure to listen to the middle ones too.
If you are unsure, you can upload 2-3 candidates under different names in Step 4: Publish and decide by trying them in practice.
Next Steps
- Publish the selected checkpoint: Step 4: Publish
- Retrain with different hyperparameters: Step 2: Preprocessing & Training